Curve Fitting
Curve fitting in MatDeck is a calculation on the sheet. The measured points, the model, the coefficients and the residual stay on the same page, so a bad fit is visible before the numbers are copied into a report.
This group is the fitting side of the shop. Polynomials, splines, nonlinear least squares, exponential and power laws, peaks, residuals, confidence bands, custom models, calibration curves, robust fits, overlays and a report publisher are separate products. Each one ships in 14 versions.
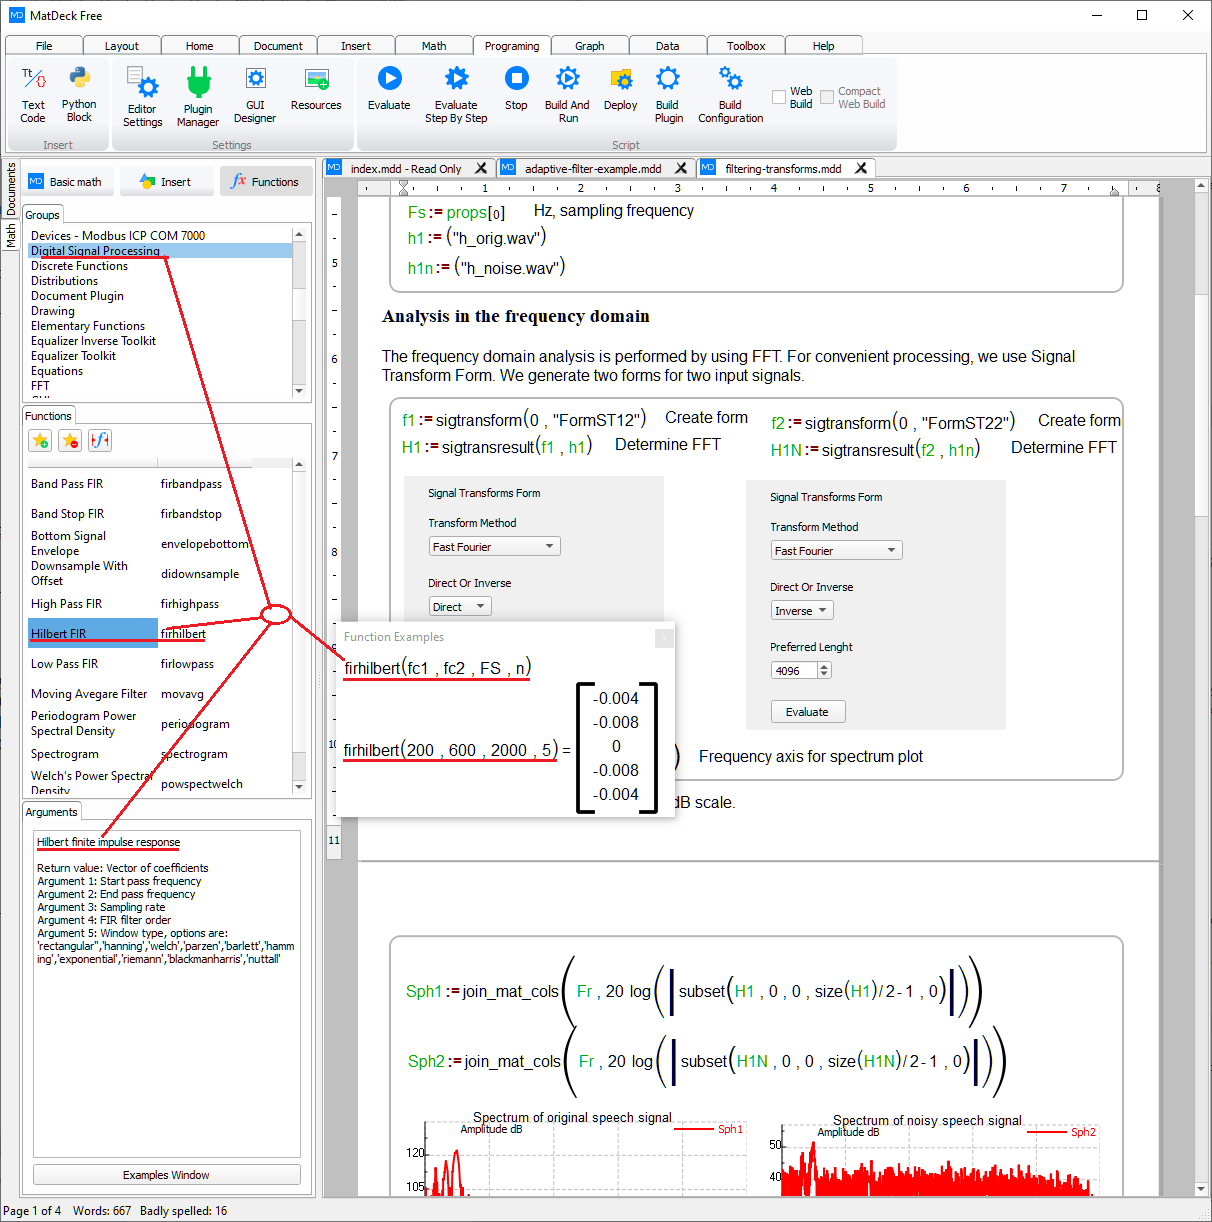
On labdeck.com, MatDeck is the document those fits run in. The products here are the pieces of that workflow: bring the points in, fit the curve, and publish the page you calculated on.
Products in this group (12)
- Polynomial Fit Studio — Fit x-y data with polynomial models and keep the residual on the same sheet.
- Spline Interpolation Pack — Piecewise splines and interpolation between measured points.
- Nonlinear Least Squares — Fit a custom nonlinear model and leave the residual next to the curve.
- Exponential and Power Fits — Exponential, logarithmic and power-law fits for growing or decaying data.
- Peak and Baseline Fitting — Separate peaks from a baseline before the fit is reported.
- Residual Analysis Sheets — Residual plots and error tables that show whether the fit is honest.
- Confidence Interval Plots — Draw a band around the fitted curve from the same calculation.
- Custom Model Editor — Write the model equation on the sheet and fit its parameters.
- Calibration Curve Builder — Build a calibration curve from standards and read unknowns from it.
- Robust Outlier Fitting — Down-weight outliers so one bad point does not own the curve.
- Multi-dataset Overlay — Fit and plot several data sets on one set of axes.
- Fit Report Publisher — Publish the data, the curve, the coefficients and the residual as one report.